Tuning Access Query Performance
The four best tools/techniques for tuning Access query performance: JetShowPlan, Process Monitor, TraceSQLMode, and SQL Profiler.


We've all been there before. You take the time to develop a complex report. You spend hours on your development machine getting it just right. You install the new feature for your users. You go to your usual guinea pig QA tester and have them open the report. And then....nothing. You stare at the screen for a few seconds. The user clicks the button again to make sure they actually clicked it. The Access screen fades out and "(Not responding)" appears in the title bar of the window. Your user turns to you with understated sincerity and says, "I don't think it's working." That's when you notice the status bar in the bottom corner of the screen. You see the progress bar crawling slowly to completion. And you groan inwardly as Access silently taunts you with the words, "Running query."
And then you utter the five words that every developer hates to admit they say.
"It worked on my computer."
Tail between your legs, you slink back to that trusty development machine to figure out went wrong.
Development vs. production
First, you run the report again to confirm it works. If you watch closely, you can see the words "Running query" flash in the status bar as the report opens in under two seconds on your machine. Amazing. It's the exact same code. Other than the following list of items, what's the difference?
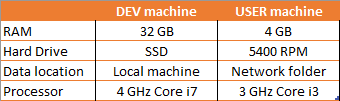
Well, I suppose we could use our devevelopment machine's specs as minimum hardware requirements. Unfortunately, that would almost certainly be no help. When a query runs fast on a development machine but slow on a user machine, then 99% of the time 99% of the problem lies in that third row: data location.
How do we fix it? I check a few obvious things first. These are items that often cause problems:
Calling VBA functions in the query
This is a major cause of performance problems. It's an easy mistake for both beginners and experts to make. The difference is that experienced users have been burned by it enough that they know to look for it right away.
Here's the scenario. You pass a column from a large linked table to a VBA function and then filter on the result of the function. When you do this, Access has no choice but to scan every row of the table to see if the criteria is satisfied. If the table is in a database on a network drive or a remote SQL Server, then every record in the database must be transferred over the slow network connection.
If you absolutely have to do this, you can minimize the performance hit by adding an additional criteria that can be evaluated first to reduce the number of records that need to be transferred and run through the VBA function.
Subqueries, outer joins, cartesian joins, and non-indexed joins
For experienced Access developers, these are the items that cause most of the performance problems.
Structured Query Language (SQL) is a declarative programming language. This differs from VBA, which is a procedural language. What's the difference? In a procedural language, you tell the computer the step-by-step procedure for how to do its job. In a declarative language, we declare what we want the outcome to be and let the computer (read: underlying SQL implementation) decide how to accomplish it.
It's analogous to the way Michael Scott declares bankruptcy:
Most of the time, SQL's declarative nature is a good thing. One of the strengths of declarative languages in general is their strong Signal to Noise ratio. The language is both concise and (relatively) human readable.
Some very smart people have spent time optimizing the set-based operations for which relational databases are best known. By allowing the database implementation to figure out the ideal procedures required to return the data or perform our requested operation, we benefit from the knowledge and abilities of those very smart people.
Occasionally, though, the implementation makes sub-optimal choices. When that happens, declarative languages can be very frustrating to debug. That's because they operate largely as black boxes. You tell them what you want via an SQL query or statement, they do a bunch of stuff, and then return your requested data or the results of the operation.
Sometimes, the only way to troubleshoot SQL performance problems is to peer inside the black box. To do that, I use a few different tools and techniques. I'll describe each briefly here and devote future articles to more lengthy discussions.
- JetShowPlan: creates a showplan.out text file; best for troubleshooting problems with queries where all the tables come from .mdb/.accdb files
- ProcMon: shows every network, file system, and registry call made at the lowest level of Windows; works best for identifying excessive calls to .mdb/.accdb files on network drives
- ODBC TraceSQLMode: creates a sqlout.txt text file; best for troubleshooting problems with queries using tables linked to SQL Server
SQL Server Profiler* SSMS XEvent Profiler: monitor incoming and outgoing commands and data from the SQL Server end; especially helpful for understanding how Access implements continuous forms bound to SQL Server linked tables (hint: it's probably not what you'd expect)
* Apparently, SQL Server Profiler has been deprecated; I've never actually used SSMS XEvent Profiler, but it seems like it is the future