Debugging Code in twinBASIC
Experienced developers know that they spend more time debugging code than writing it. Luckily, twinBASIC has some capable debugging tools.

To learn more about twinBASIC, join me at this year's virtual Access DevCon where I will be presenting this exciting new project from vbWatchdog creator, Wayne Phillips.
Debugging Code
This article is a brief overview of debugging code in twinBASIC. Spoiler alert: it's very much like the process of debugging code in VBA. And that's a good thing! I think VBA's debugging environment is massively underrated.
If you're more into video than text, Wayne has a YouTube video (twinBASIC - Debugging in action (32-bit and 64-bit)) that demonstrates these features.
Debug console (aka, immediate window)
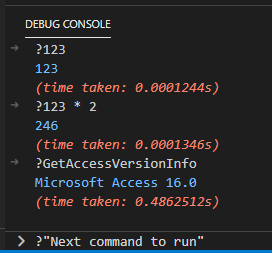
twinBASIC can run in both interpreted and compiled modes. The twinBASIC VS Code extension contains an interpreter that allows us to run ad hoc code from the Debug Console. This works much the same way as the immediate window in VBA.
There are a few differences. As you execute each line of code, twinBASIC displays the execution time. This is a nice bit of built-in profiling. I do wonder if that will ultimately be an optional feature that can be toggled on and off.
Also, you can't just place your cursor on an existing line in the output and press enter to re-execute it the way you can in VBA's immediate window. You would need to copy and paste the line into the prompt at the bottom of the console, or use the up and down arrows to cycle through past commands. It works much more like a typical terminal window (like the cmd prompt or Powershell console) than the Wild West of the Immediate Window where anything goes.
When I first started writing code in .NET, I found that I sorely missed this capability. I'm glad it's available in twinBASIC.
Stepping through code
Stepping through code is basically the same as VBA. You can:
- Run (F5 in both VBA and twinBASIC)
- Break/Pause* (Ctrl + Break in VBA; F6 in twinBASIC)
- Stop (no shortcut in VBA; Shift + F5 in twinBASIC)
- Step Into (F8 in VBA; F11 in twinBASIC)
- Step Over (Shift + F8 in VBA; F10 in twinBASIC)
- Step Out (Ctrl + Shift + F8 in VBA; Shift + F11 in twinBASIC)
- Run to Cursor (Ctrl + F8 in VBA; not available in twinBASIC)
Here are some notes about stepping through the code. Some of these could be temporary issues related to this being a beta build:
- Break/Pause does not seem to be working at the moment
- You can start execution of a public routine by pressing F5 while the cursor is inside a routine with no parameters (this is the same behavior as VBA)
- Unlike VBA, you can also use F5 to start execution of a public routine with one or more optional parameters as long as there are no required parameters (in VBA, pressing F5 on such a routine just opens the Macros dialog)
- Unlike VBA, you cannot pause execution, make changes to the source code, and then continue with execution using the updated source code; twinBASIC displays the message, "[EDIT & CONTINUE] not yet supported. Aborting." which one can infer means that "Edit & Continue" may be supported in the future
Breakpoints
Breakpoints appear to work as you would expect, though there are some differences.
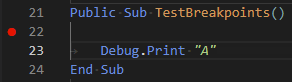
While VBA will not allow you to add a breakpoint to a non-executable line of code, twinBASIC has no such qualms. The breakpoint won't actually be hit, though.
The context menu shows an option to add an "Inline breakpoint." In theory, this would allow you to break on a second or third command on a single line of code. In practice, this is not currently working.

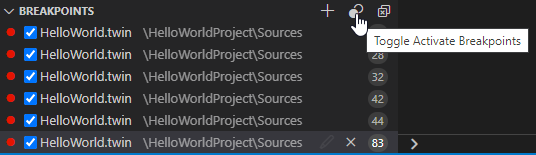
One nice feature that twinBASIC has that VBA is sorely missing is a command to temporarily Disable all breakpoints. There's no way to temporarily inactivate breakpoints in VBA.
Another nice feature is a Breakpoint explorer window, that shows all the active breakpoints, where they are in the code, provides a hyperlink to jump you straight to the associated line of code, adds a button to remove each breakpoint, and includes a button to toggle all breakpoints on and off.
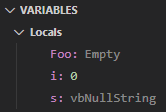
Locals window
In twinBASIC, the Locals window is called the Variables window. Within the window, there is a subheading for Locals. I assume this means that the window will also display module-level and globally-scoped variables, but I can't be sure because this beta version of the language does not yet support them.
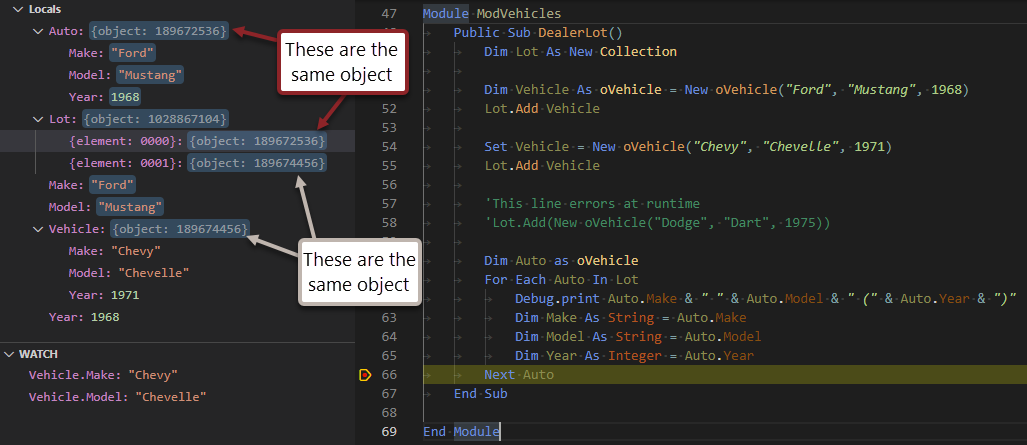
One feature that I really like about the Locals window is that it shows the address of object instances in memory, making it easier to identify when two different variables are pointing to the same object in memory.
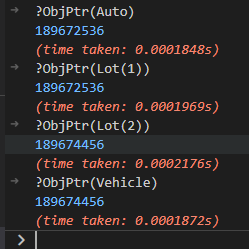
This is the same information you would get using the ObjPtr() function in VBA. In fact, we can prove it by executing ObjPtr() calls on the associated variables via the Debug Console:
Watch window
These are the main differences between the Watch window in VBA and twinBASIC:
- twinBASIC does not support "Break When Value Is True" and "Break When Value Changes" watch types (those features can cause performance issues in VBA, though)
- twinBASIC does not support context-sensitive watches like in VBA where you can specify the Procedure and Module where the watch is active
Call stack window
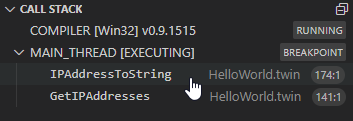
Since twinBASIC is multi-threaded, the call stack window shows the call stack for each active thread. Each thread can be collapsed out of the way so you can focus on the most relevant one.
To jump to the line of code referenced in the call stack, you need only click on the appropriate line and VS Code will jump you straight there.
Background image of grass by Pexels from Pixabay
Anteater image by Clker-Free-Vector-Images from Pixabay