Signal vs. Noise: ShowPlan.out Edition
Reading showplan.out files can be intimidating for new and experienced Access developers alike. This simple rule will help get you started.


Colin Riddington wrote a series of articles performing "Speed Comparison Tests."
I found article #8, Optimize Queries, to be especially relevant to my upcoming presentation on Troubleshooting Query Performance. In the article, Colin takes a moderately complex query and optimizes it through a series of incremental changes. It's a fantastic introduction to the query optimization process.
What I was most interested in, though, was the showplan.out output.
In my JetShowPlan primer, I wrote a section about how you can define a showplan.out "User Defined Language" in Notepad++. This was a perfect opportunity to put that UDL to the test.
Does my Notepad++ UDL boost the signal to noise ratio of the showplan.out file?
What's So Special About the UDL?
I wanted to make the showplan.out file easier to interpret.
Specifically, I wanted to make the wrong code look wrong and the right code look right. This would boost the signal of the file.
I also wanted to hide text that I didn't immediately care about, thus reducing the noise of the file.
BAD Keywords Colored Red
These keywords highlight potential performance problems, so I color them red:
temptemporaryscanningX-Prod
The temp and temporary keywords show that the database engine is creating intermediate results, which takes time even if those temporary results only reside in memory. These are the least BAD keywords.
The scanning keyword shows that the db engine had to perform a full table scan. In other words, it had to examine every single row of the table. This can happen if you try to sort by a non-indexed field or use a custom function in a WHERE clause or any number of other things. This is the most medium BAD keyword.
The X-Prod keyword appears when the db engine had to perform a cross-product join between two or more tables. There are rare cases where this is necessary, but most of the time it is a HUGE red flag. The cross product of two ten-row tables is an output table with 100 rows (10 x 10). This is the most BAD keyword.
GOOD Keywords Colored Blue
The opposite of BAD is GOOD. These keywords highlight areas where the db engine was able to optimize its query execution plan to save time:
indexrushmore
Both of these keywords refer to indexes. And when it comes to SELECTing records, indexes are good (they're not so good when it comes to INSERT/UPDATE/DELETEing records, which is why you should not throw them on every single database column just for the heck of it).
Rushmore refers to special indexes that are highly optimized for the Access Jet/ACE database engine. In other words, rushmore is the most GOOD keyword.
"Inputs to Query" Sections Made Foldable
The other thing I find annoying when reading a showplan.out file are all the lines dedicated to listing all of the "inputs to the query," including:
- Tables
- Indexes
- Index statistics
Don't get me wrong, this information is handy to have available, but I don't want it taking up valuable screen real estate and distracting me from the actual steps used to build and execute the query plan.
Thus, the Notepad++ UDL adds an option to collapse these sections. You can collapse them one at a time using the plus/minus signs in the left margin of the window. You can collapse all of them using the Notepad++ menu, View > Fold All (shortcut key [Alt] + [0]).
Before and After
To really appreciate the benefits of this UDL, I want to show a before and after screenshot of the showplan.out file.
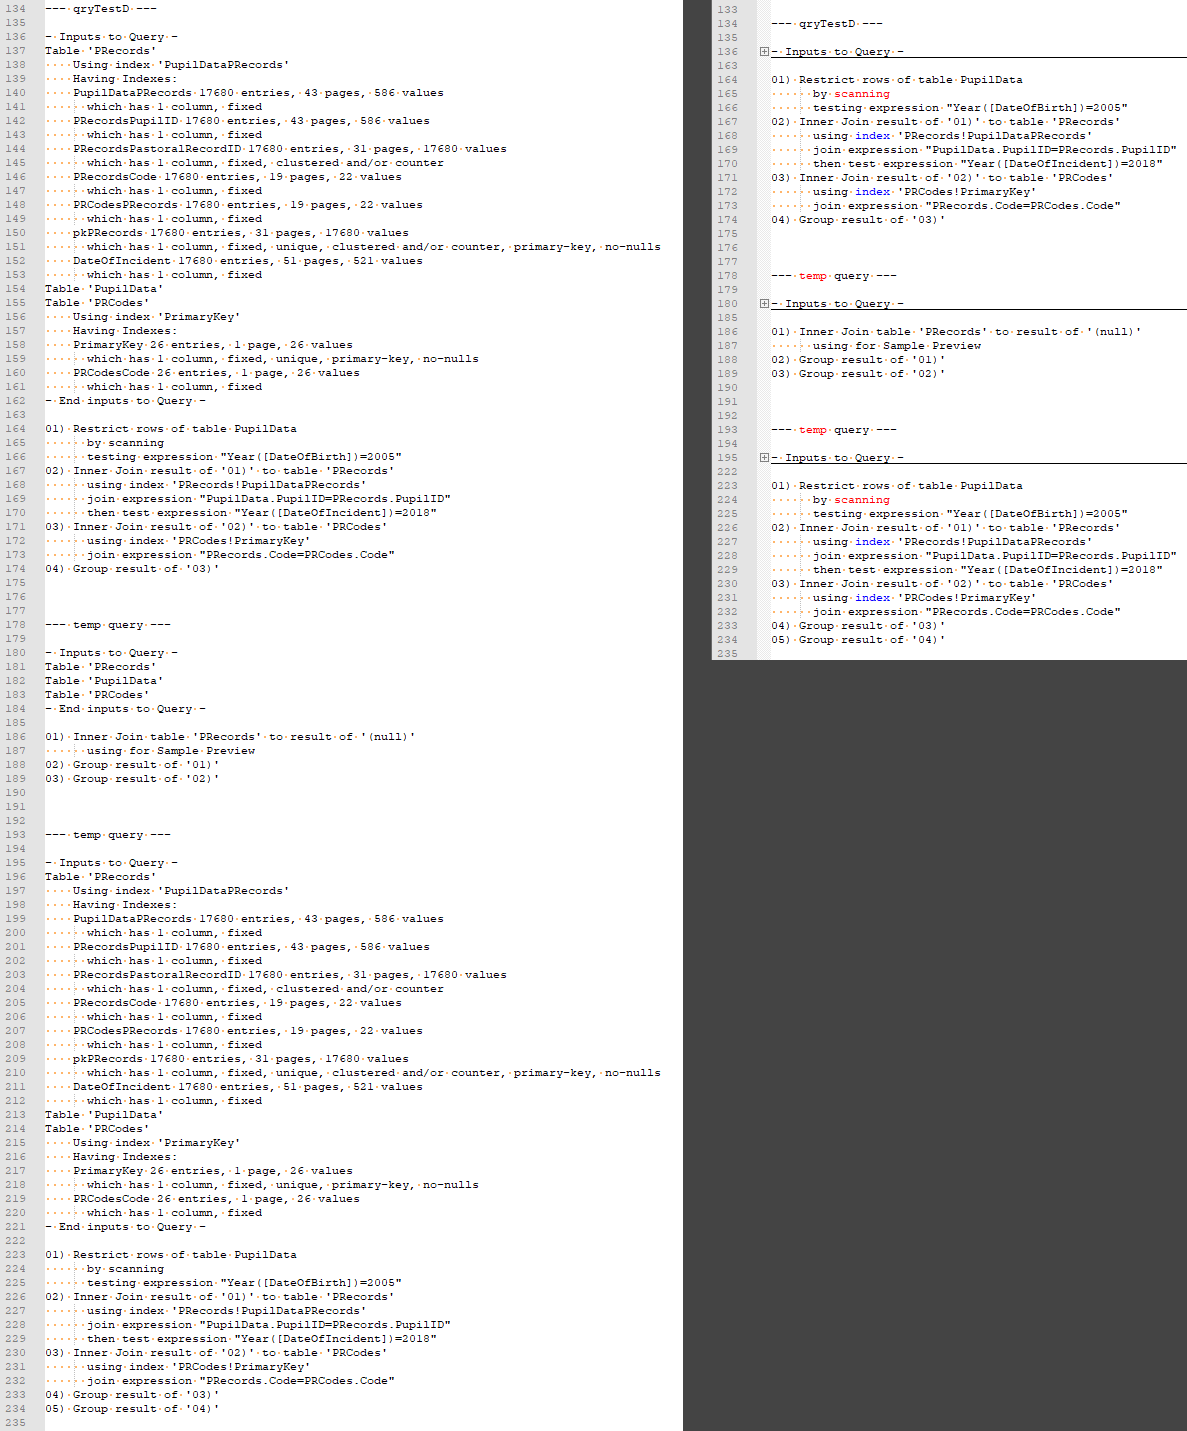
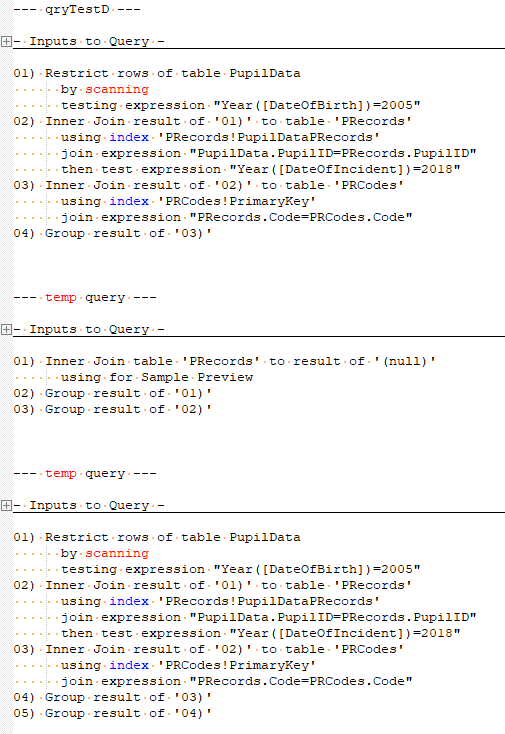
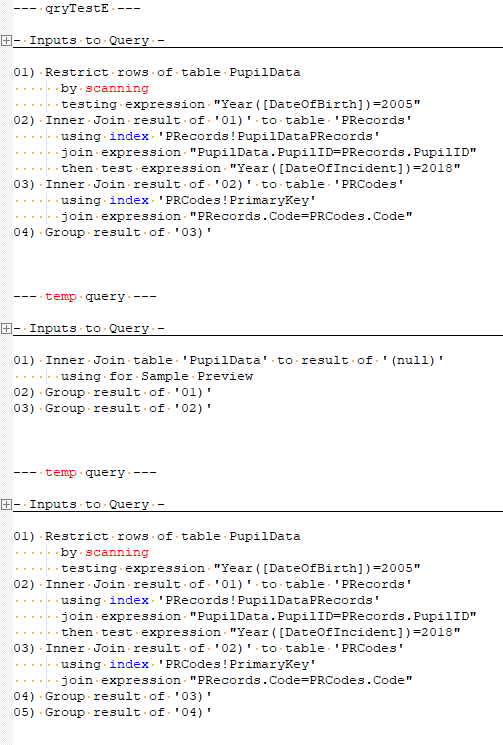
qryTestD).The original on the left is a giant Wall of Text™.
The UDL-ified version on the right is faster to read and easier to scan for problems.
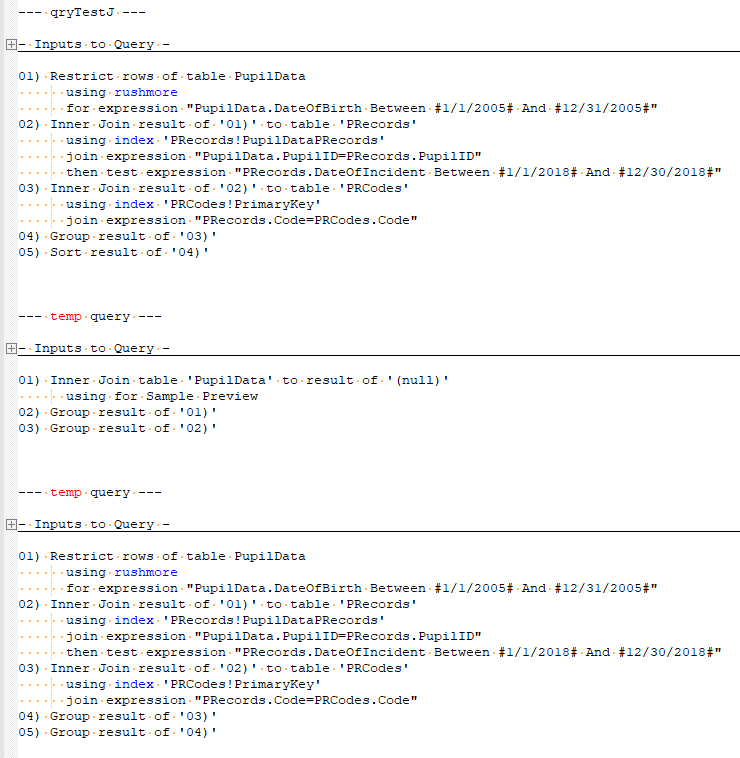
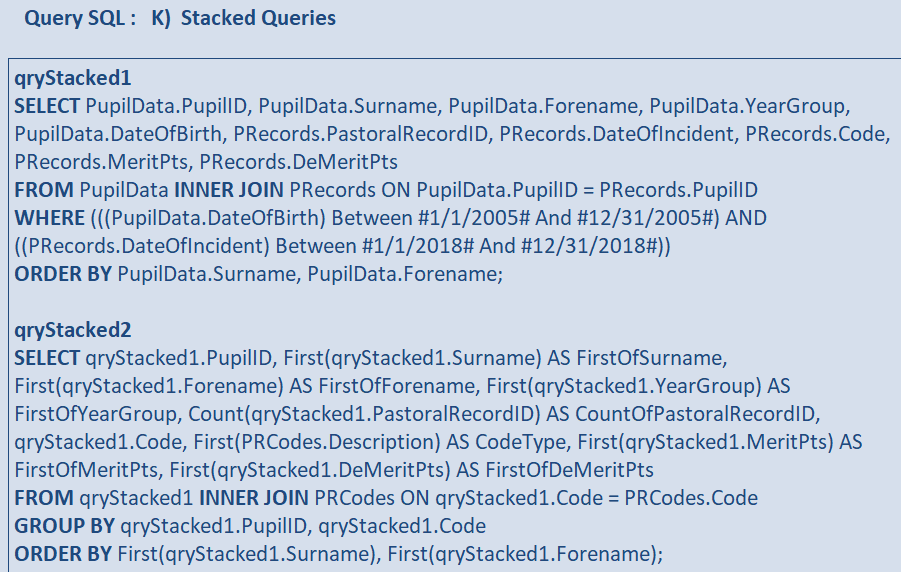
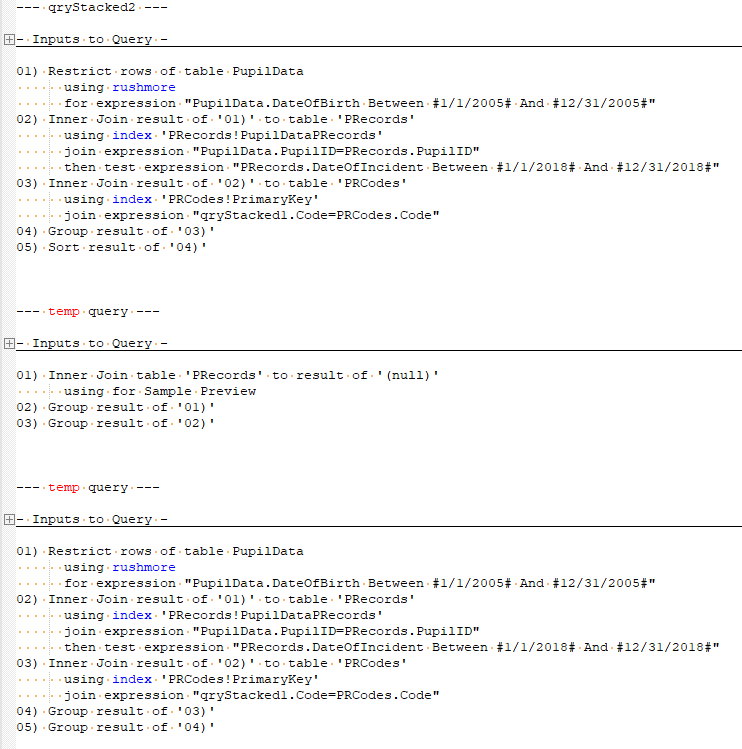
Putting My Keywords to the Test
I was curious about whether my BLUE and RED keywords really correlated with query performance.
I was greatly relieved to see that they do:
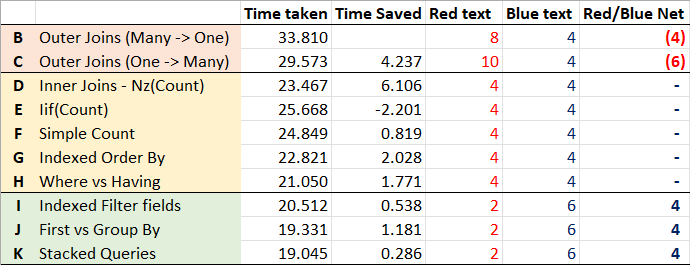
I ran each of Colin's queries and then grabbed screen captures of the resulting showplan.out files in Notepad++ (see below for each screenshot). In each screenshot, I counted the number of words colored red and the number colored blue. I entered the totals in the Red Text and Blue Text columns, respectively.
The net red/blue word count appears in the final column, Red/Blue Net.
As you can see, the two slowest queries (B &C) have more red words than blue words in their showplan.out file.
The five queries in the middle (D - H) have the same number of red words as blue words.
The three fastest queries (I - K) have more blue words than red words.
The Red-Blue ShowPlan Heuristic
In psychology, heuristics are simple, efficient rules, learned or inculcated by evolutionary processes, that have been proposed to explain how people make decisions, come to judgements, and solve problems typically when facing complex problems or incomplete information.
Based on these results, I propose the following heuristic:
- Query plans with more red than blue are BAD.
- Query plans with the same red as blue are OK.
- Query plans with more blue than red are GOOD.
I want to emphasize that this heuristic is a very simplified rule-of-thumb. It is not a replacement for proper analysis of the showplan.out file. It's merely a starting point.
If it makes the showplan.out file more approachable for curious Access developers, then in my mind it will have done its job.
Detailed Outputs
Here are the results of running Colin's queries on my development machine:
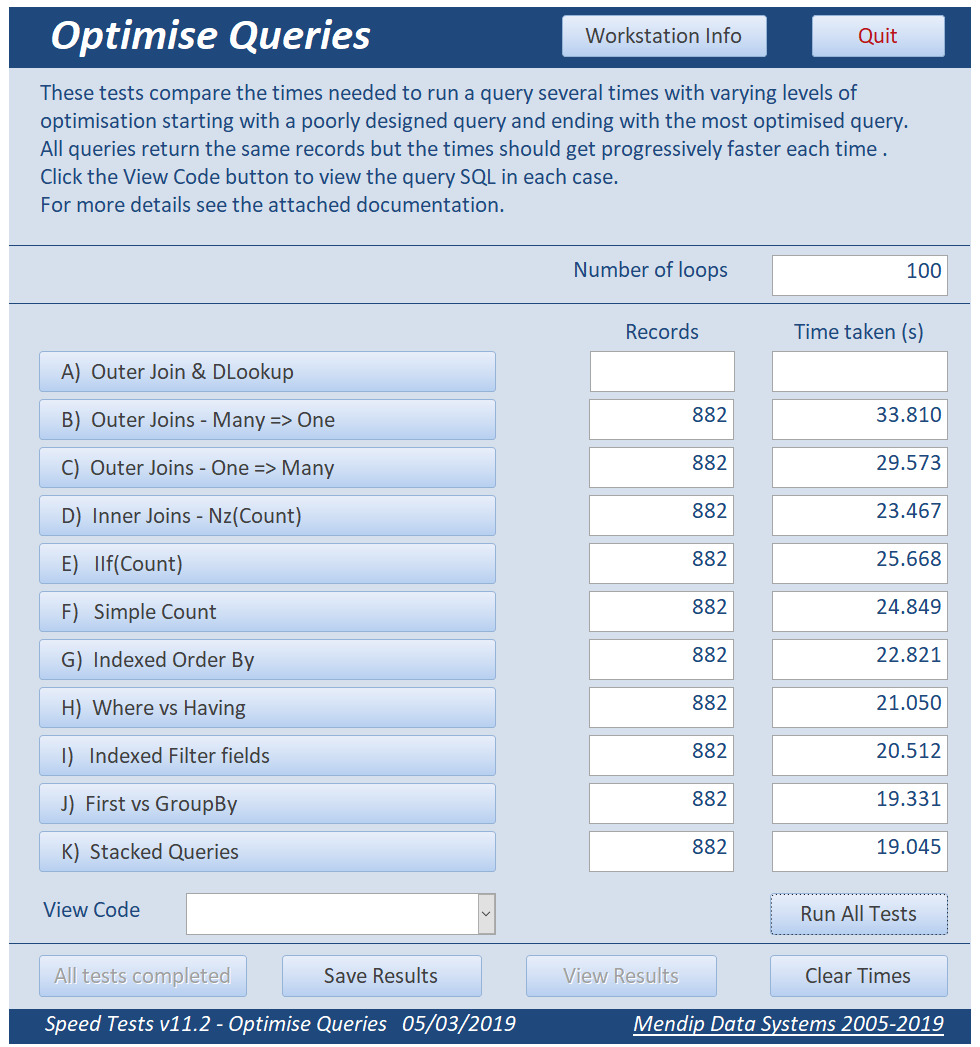
NOTE: I skipped over Query A as its performance was so intentionally atrocious it would have frozen my machine if I tried to run it through 100 (or even 10) loops.
Test Output
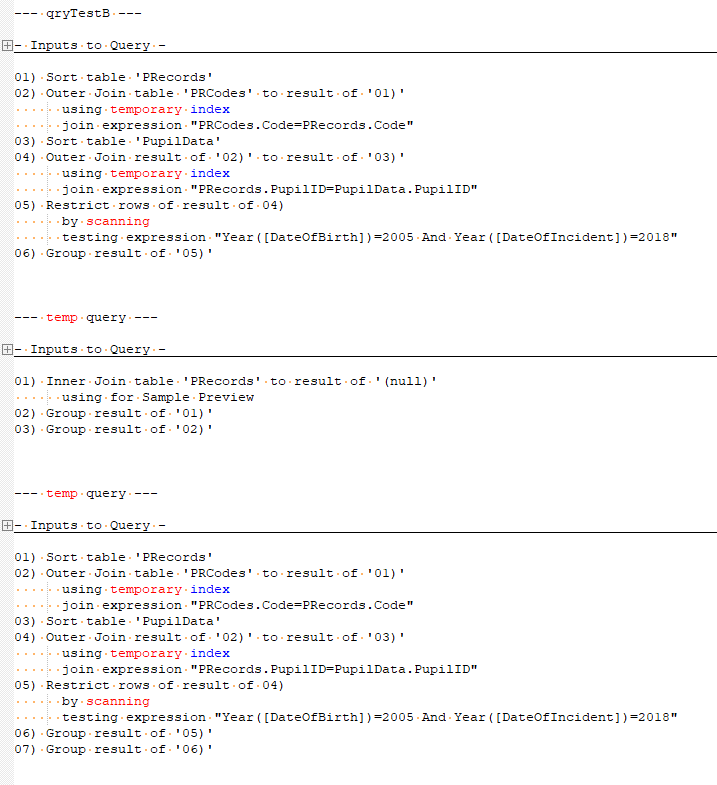
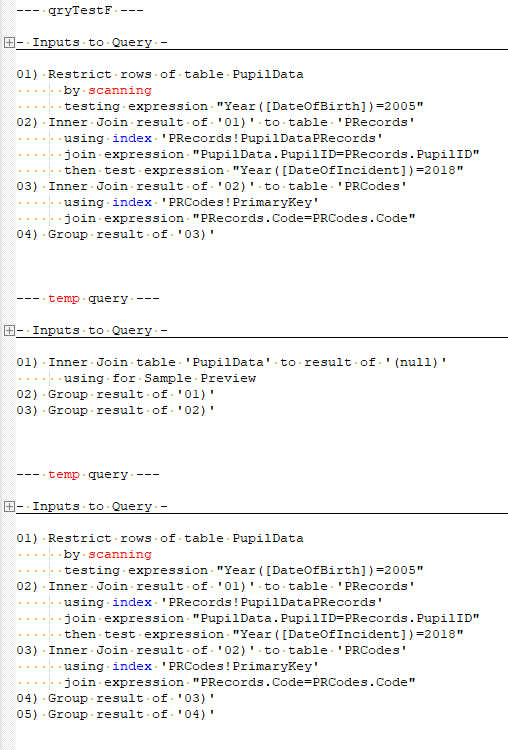
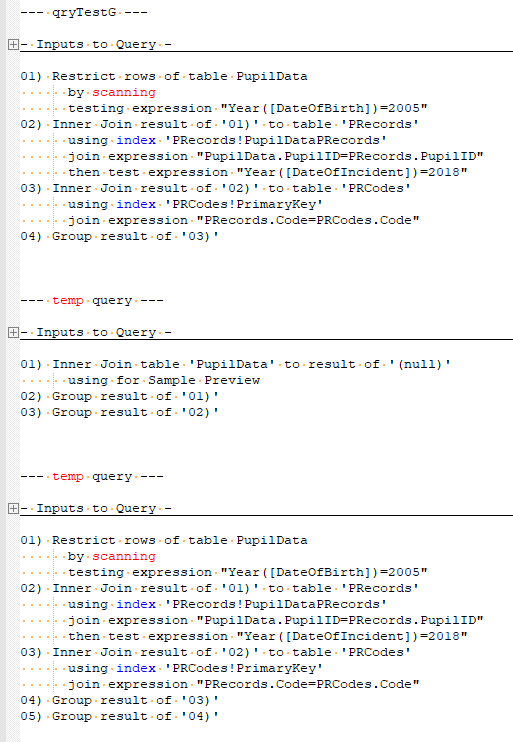
The remainder of this article is nothing more than a set of screenshots that show Colin's query SQL with its associated showplan results. Refer to Colin's article for his excellent analysis of how each query improves upon the results of its predecessor (note that in my testing, query D is actually faster than queries E and F).
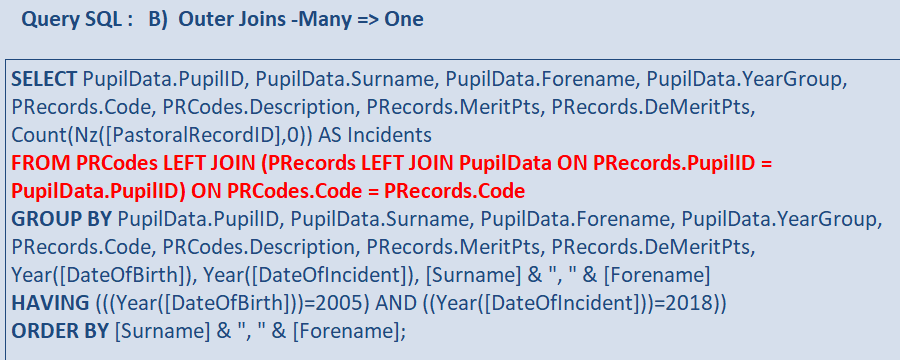
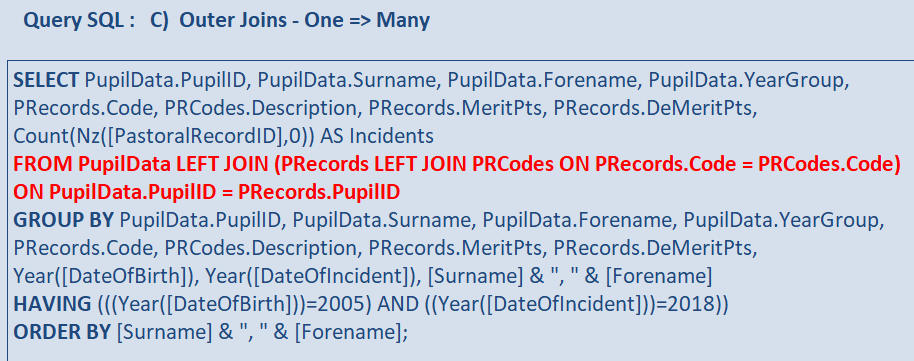
B) Outer Joins -Many => One
C) Outer Joins - One => Many
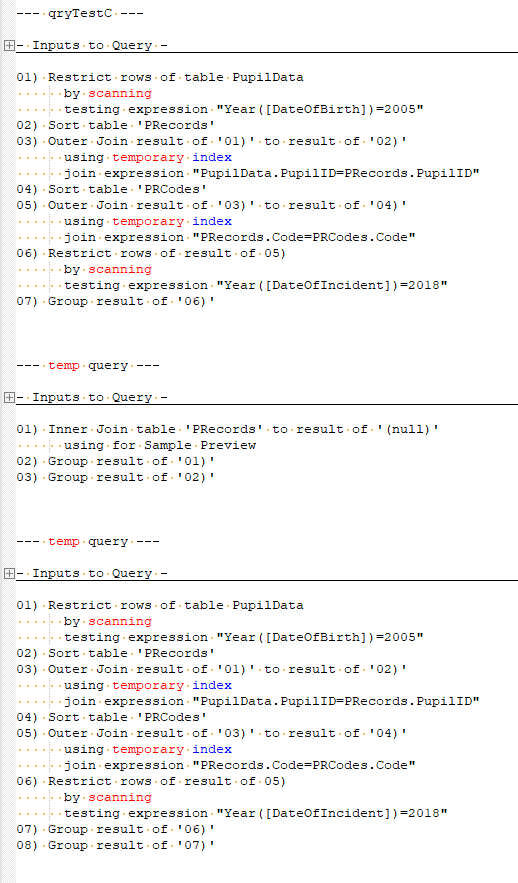
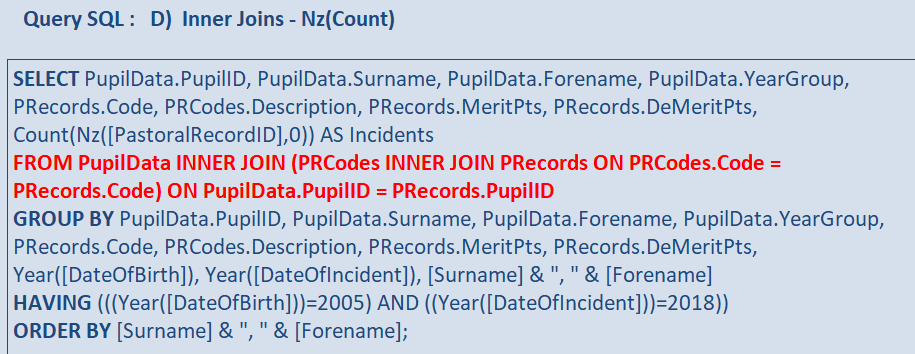
D) Inner Joins - Nz(Count)
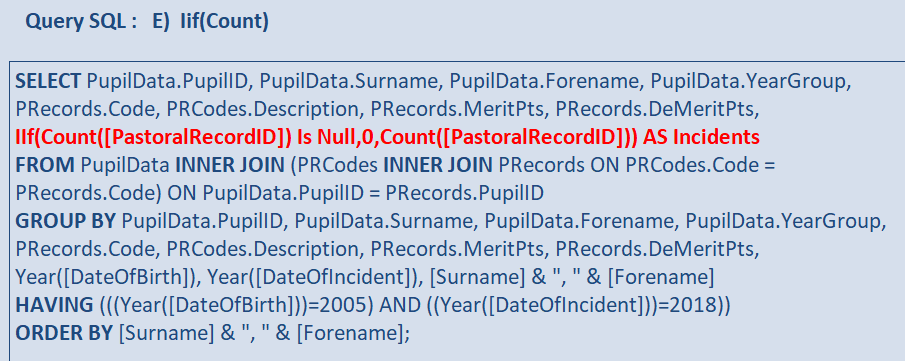
E) IIf(Count)
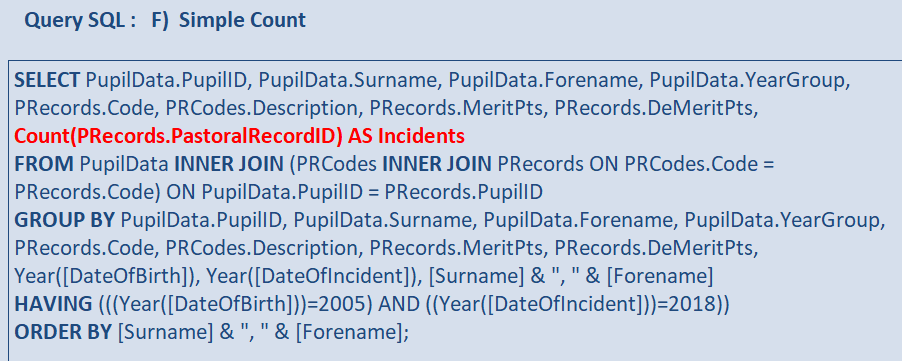
F) Simple Count
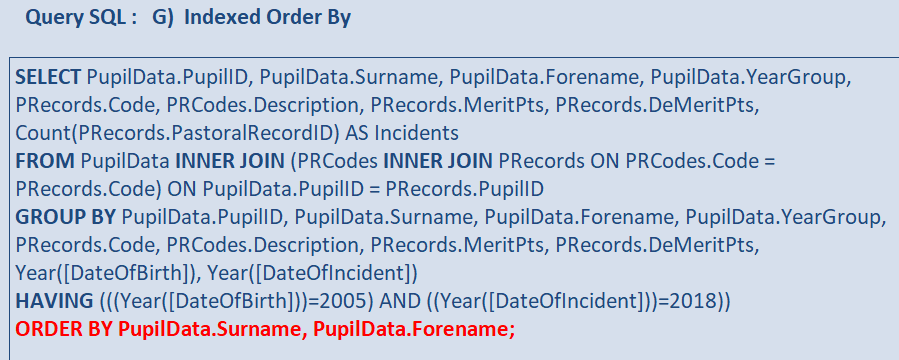
G) Indexed Order By
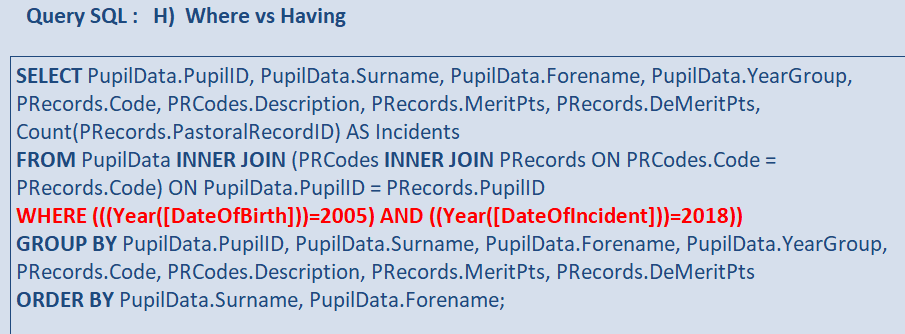
H) Where vs Having
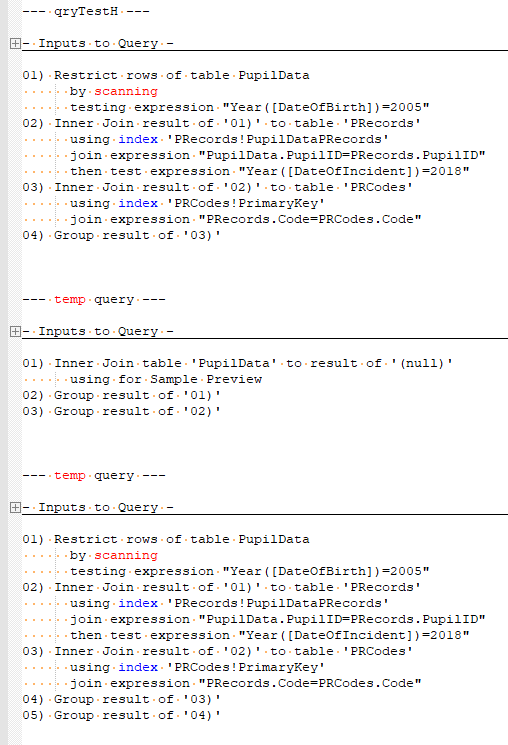
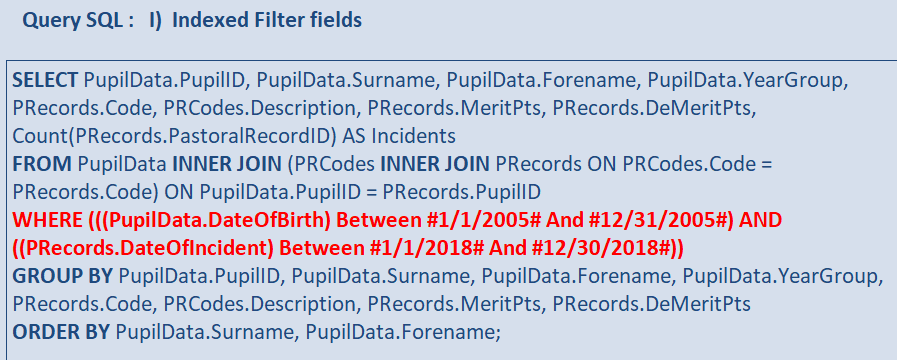
I) Indexed Filter fields
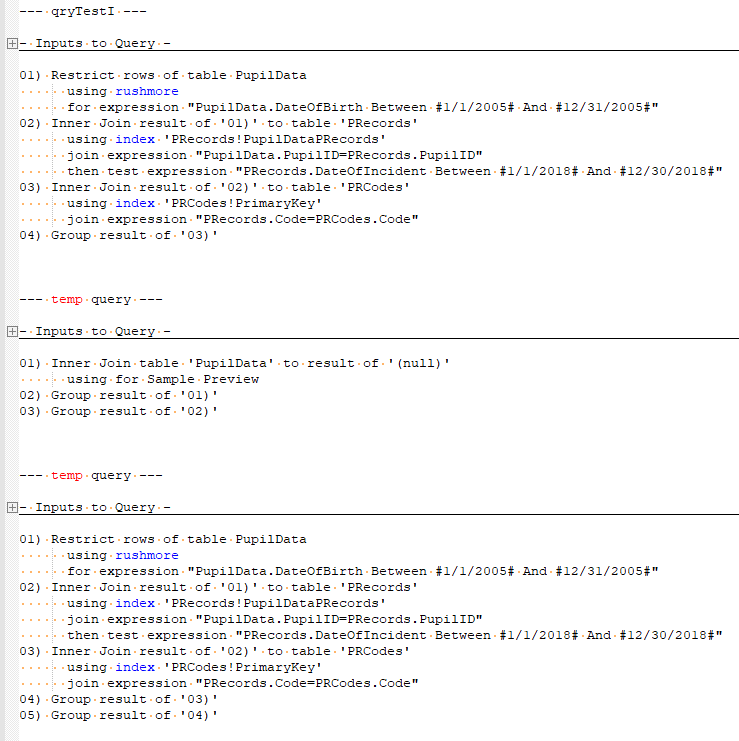
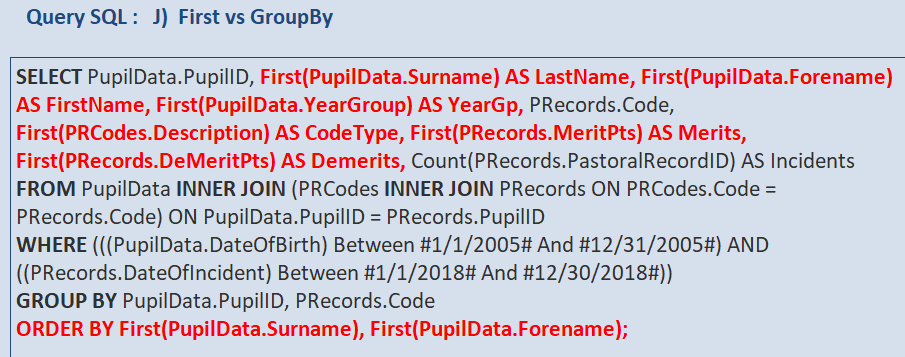
J) First vs GroupBy
K) Stacked Queries
External references
 Colin Riddington

Referenced articles
 Mike Wolfe
Image by Chris Crowder from Pixabay