Monitoring Memory Usage in a 64-bit Access Application
According to the Windows API, my 64-bit Access application uses more than 2 TB (that's *terra*-bytes) of memory. Something tells me that's not right...


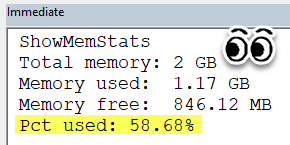
With newer versions of 32-bit Access, your applications can only use about 850 MB of memory:
While that may seem like plenty, certain actions will chew through memory quickly–like subqueries, complex reports, and image operations. For that reason, it's more important than ever to keep an eye on your application's memory consumption during development.
This is relatively straightforward if you do your development in 32-bit Access. For one thing, you will see the same memory errors as your end users. And to monitor memory usage, you can use the GlobalMemoryStatus API function as I demonstrated here.
But what if you develop using 64-bit Access and some of your users are running 32-bit Access? In that case, you could be creating memory bombs in your application without even realizing it. It would be nice, then, if you could monitor your app's memory usage to make sure you don't go over that 850 MB threshold.
Unfortunately, there is no good way to determine the amount of memory in use by Access when running in 64-bit mode.
Memory Status APIs
The GlobalMemoryStatus API does not return a "Memory Used" value directly.
The screenshot I posted above calculates "Memory Used" as the difference between the total virtual memory and the total available virtual memory. For 32-bit Access, this works quite well. You can call the GlobalMemoryStatus function and watch as the available virtual memory approaches zero. Once it gets close, you will start observing memory-related errors, such as "System resource exceeded" and "Out of memory."
The GlobalMemoryStatus function does not work with 64-bit memory spaces. Instead, we need to use the extended version, GlobalMemoryStatusEx. The output below shows human readable memory stats as returned by the API function GlobalMemoryStatusEx on my Access 64-bit dev machine:
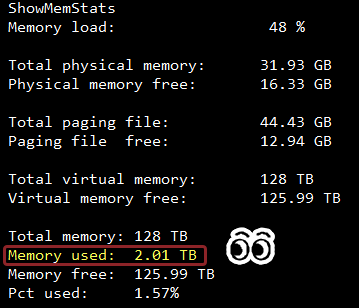
The "Memory used" amount shows 2.01 TB. There's no way Access is actually using that much memory.
As with GlobalMemoryStatus, there is no "memory used" value returned by GlobalMemoryStatusEx. As before, I'm calculating it as the difference between the Total addressable Virtual Memory (128 TB) and the Total Available Virtual Memory for the current process (125.99 TB).
What's Really Going On Here?
I think msaccess.exe itself may be reserving a sizeable chunk of the virtual memory's address space since there is so much of it. At least, that's the only explanation I can come up with. The upshot is that there is no particularly useful memory statistics that we can show for 64-bit Access.
The "Memory Load" is an interesting one, but ultimately it is useless for debugging purposes since it is mostly dependent on the physical RAM of the dev machine along with the memory consumption of every other running application.
Readers, Help!
What am I missing? Is there some other Windows API function that can help us monitor our 64-bit Access application's memory usage? Let me know in the comments below.
Cover image created with Microsoft Designer