Using ProcMon to Troubleshoot Registry Calls
Finding the correct registry keys for JetShowPlan and ODBC TraceSqlMode can be tricky. Let ProcMon take the guesswork out of the process.


JetShowPlan and ODBC TraceSQLMode are two powerful query analysis tools for Microsoft Access.
Both of these tools must be enabled from the Windows registry. And finding the correct registry keys can be tricky, since they depend on the bitness of VBA, the Access version, Click-To-Run vs. MSI, etc. There are plenty of articles that will show you how to set these values, but sometimes it just doesn't want to work for your environment.
Let me show you a foolproof way to discover the correct registry keys.
ProcMon to the Rescue
Process Monitor is my favorite tool in the comprehensively excellent SysInternals suite from Mark Russinovich.
As the name implies, it monitors Windows processes and logs all of their interactions with:
- the File System
- the Registry
- the Network
Setting Up the Filter
The first step is to show only the activities from Microsoft Access.
To do this, we set up a Process Name filter and Include msaccess.exe:
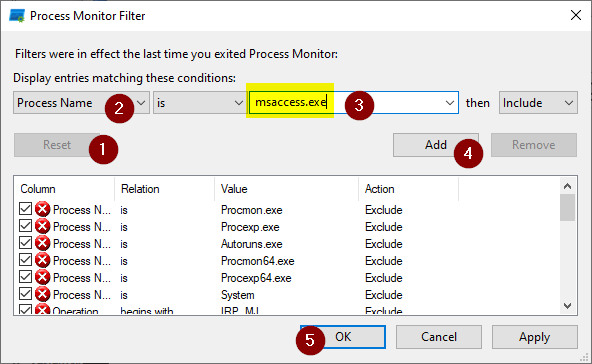
msaccess.exe (3), click [Add] (4), then click [OK] (5).Temporarily Disable Capturing
When you click [OK], procmon will immediately start capturing. We're not quite ready for that yet, so toggle off the Capture button then clear the event log.
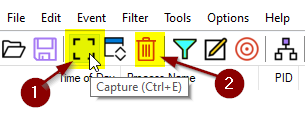
Now we can continue refining our filter.
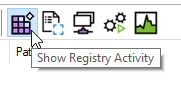
Show Registry Activity Only
There are five toggle buttons on the far right of the toolbar. We're only interested in the registry for this scenario. Leave the Registry Activity button toggled ON (it's the one on the far left). Toggle off the other four buttons.
The key to making procmon a useful tool is to remove as much noise as possible from its event capture log.
Before we start capturing again, we are going to add a couple of more filters.
Locating TraceSQLMode
We'll start by finding the TraceSQLMode value because it's the easier one to locate.
Click the Filter icon so we can add another filter:
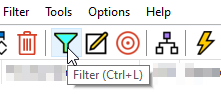
We could have done this at the beginning when procmon first started up, but I wanted to show you how to get back to the filter once the program is running.
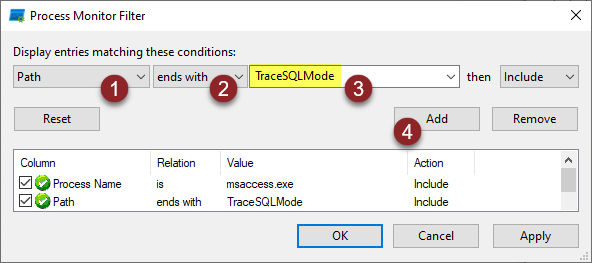
When the filter dialog opens:
- Choose "Path" from the first dropdown
- Choose "ends with" from the second dropdown
- Enter "TraceSQLMode" in the third dropdown
- Click the [Add] button
The Filter dialog should look like this when you're done:
Click [OK] to close the dialog. We're almost ready to begin.
Begin the Capture
Before we start capturing, we want to make sure that all existing instances of Microsoft Access are closed. Multiple instances won't hurt anything, but they will add noise to the procmon event log.
When you are ready to begin, perform the following steps. You'll want to minimize the amount of time between when you start capturing and when you launch Access. The procmon log fills up fast!
- Start capturing in procmon ([Ctrl] + [E])
- Launch Microsoft Access (give it a few seconds to complete its initial startup)
- Stop capturing in procmon ([Ctrl] + [E])
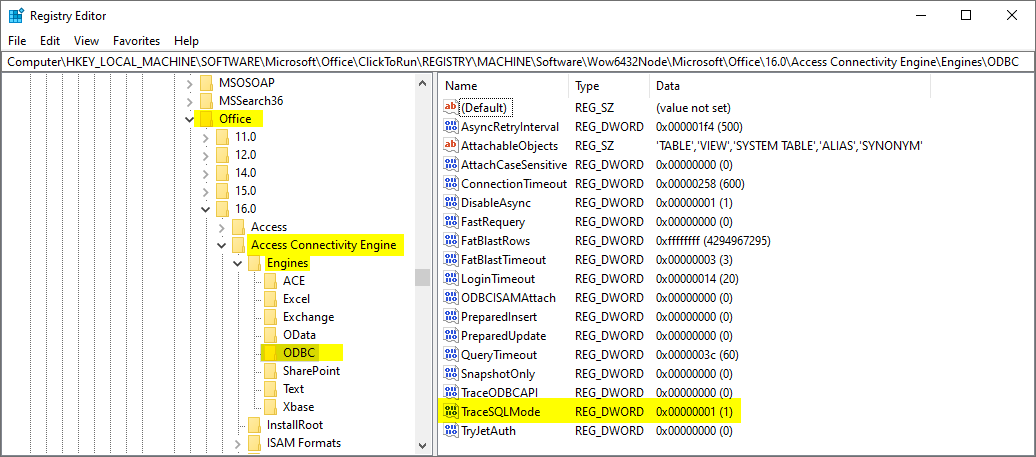
If all went well, you should only have a single result:

I collapsed the Path column in the screenshot because the results were so wide. Here's the value of the Path column:
HKLM\SOFTWARE\Microsoft\Office\ClickToRun\REGISTRY\MACHINE\Software\Wow6432Node\Microsoft\Office\16.0\Access Connectivity Engine\Engines\ODBC\TraceSQLMode
That's probably not the first place I would have looked in the registry...
Enabling ODBC TraceSQLMode
In Process Monitor, right-click on the result shown above and choose "Jump to..." (or press [Ctrl] + [J] while selected).
This will take you to the registry entry that you need to update. Double-click the TraceSQLMode value and set its "Value data" textbox to 1 then click [OK]. Close the registry and restart Access for the change to take effect.
Locating JETSHOWPLAN
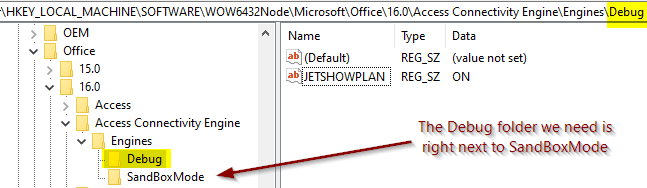
Finding the JetShowPlan key is tricky if you have never used it before because it doesn't even exist by default.
Instead, we have to search for where the key needs to go. To do that, we will search for the "SandBoxMode" folder which should exist by default. It's right next to the Debug folder (which you will have to create the first time).
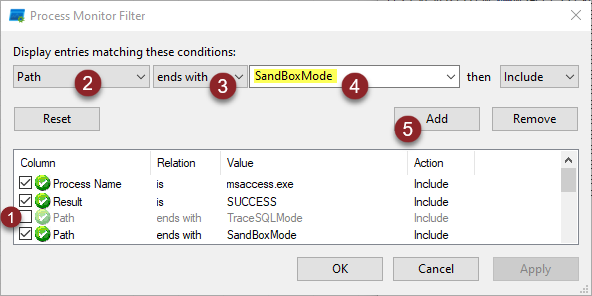
Open the filter dialog:
- Uncheck the "Path ends with TraceSQLMode" entry to disable that filter
- Choose "Path" from the first dropdown
- Choose "ends with" from the second dropdown
- Enter "SandBoxMode" in the third dropdown
- Click the [Add] button
- Choose "Result" from the first dropdown
- Choose "is" from the second dropdown
- Enter "SUCCESS" in the third dropdown
- Click the [Add] button
The filter window should look like this when you are done:
Click OK to close the dialog. Repeat the capture following the same instructions as above.
Enabling JETSHOWPLAN
If all goes well, you should get a single path to the SandBoxMode registry key.
On my machine, that path was:
HKLM\SOFTWARE\WOW6432Node\Microsoft\Office\16.0\Access Connectivity Engine\Engines\SandBoxMode
You can right-click on one of the results and choose the "Jump To..." option. That will take you straight to the location in the registry where the SandBoxMode key is located.
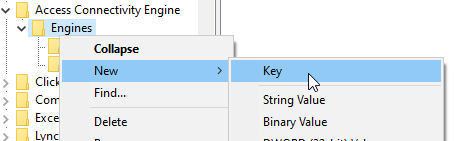
If you don't see the Debug folder, you will have to add it. Right-click on the Engines folder and choose "New > Key". Set the key name ("keys" in the registry appear as folders) to "Debug".
Next, right-click on the Debug folder and choose "New > String Value".
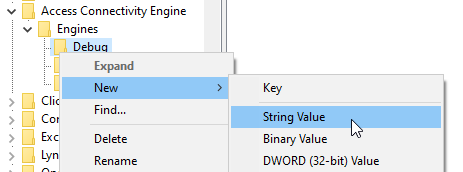
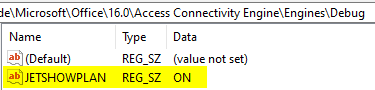
Set the name of the new value to JETSHOWPLAN. Set the Data by double-clicking on the new JETSHOWPLAN value. Enter ON to enable JetShowPlan functionality. Close the registry and restart Access for the change to take effect.
To learn more about JETSHOWPLAN, check out my comprehensive primer article:
 Mike Wolfe
To learn even more about both JetShowPlan and TraceSQLMode, join me on Thursday, March 17 (St. Patrick's Day!), for my presentation on Troubleshooting Query Performance.
External references
Referenced articles
Mike Wolfe
Image by LittleAngell from Pixabay
UPDATE [2022-03-02]: Added instructions for enabling ODBC TraceSQLMode in the registry.