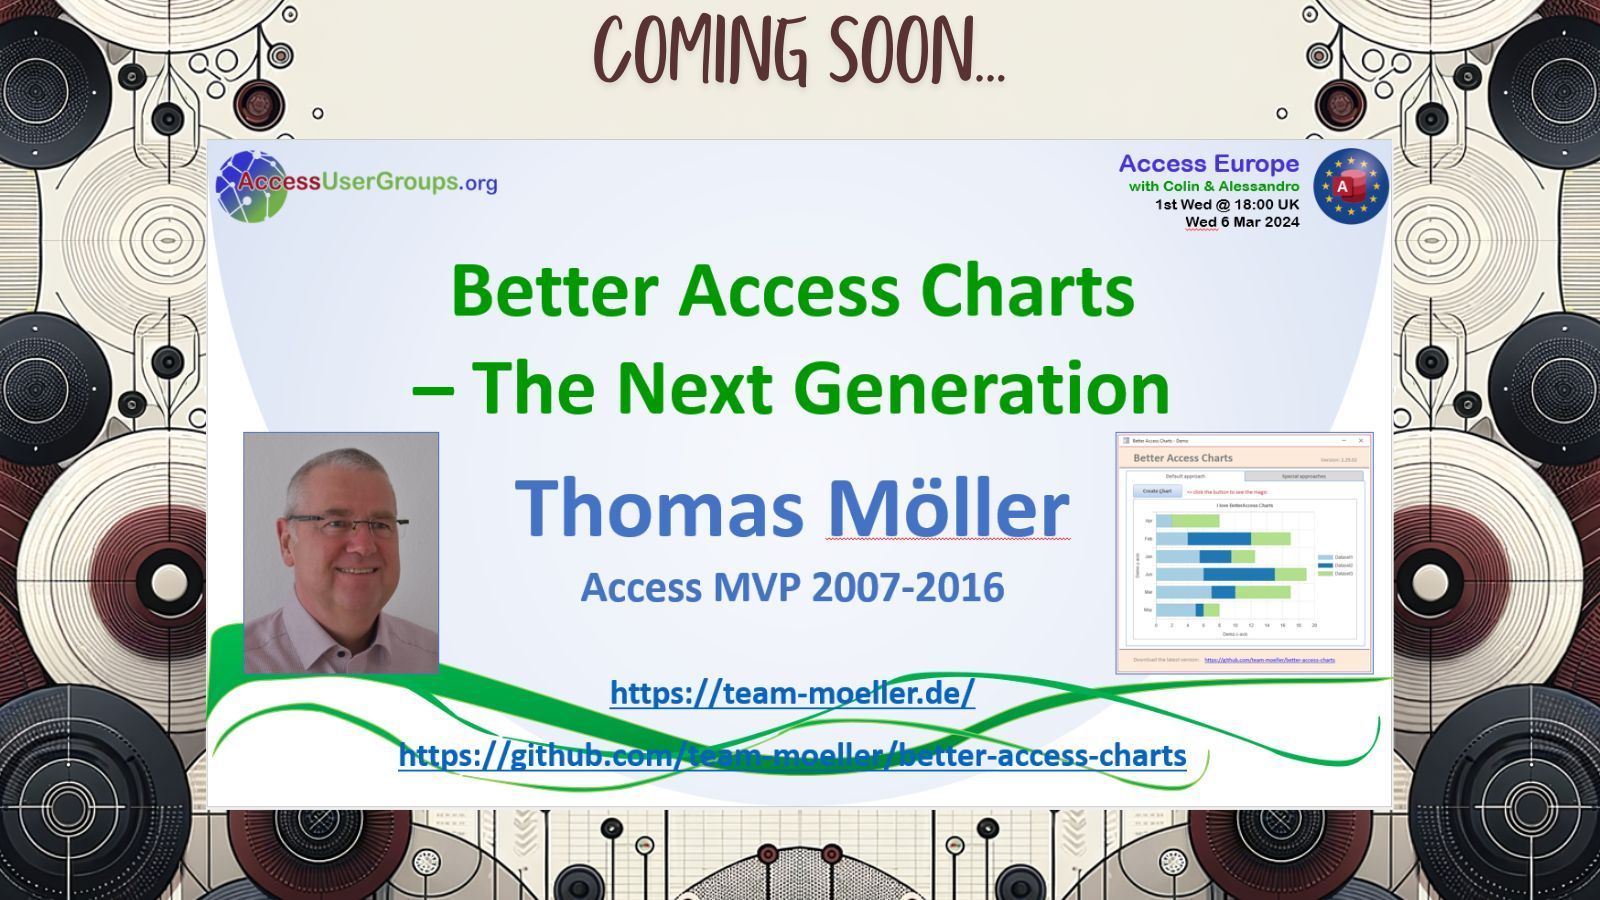
Upcoming Presentation: Better Access Charts by Thomas Möller
Thomas Möller is back with a much-anticipated follow-up to his earlier presentation on incorporating JavaScript charting frameworks in Microsoft Access.

The paucity of charting options in Microsoft Access is particularly egregious considering it is developed by the same company that's delivered impressive charting and visualization tools in Excel and Power BI.
Everyone knows the charting options in Access are subpar, including the Access engineering team:
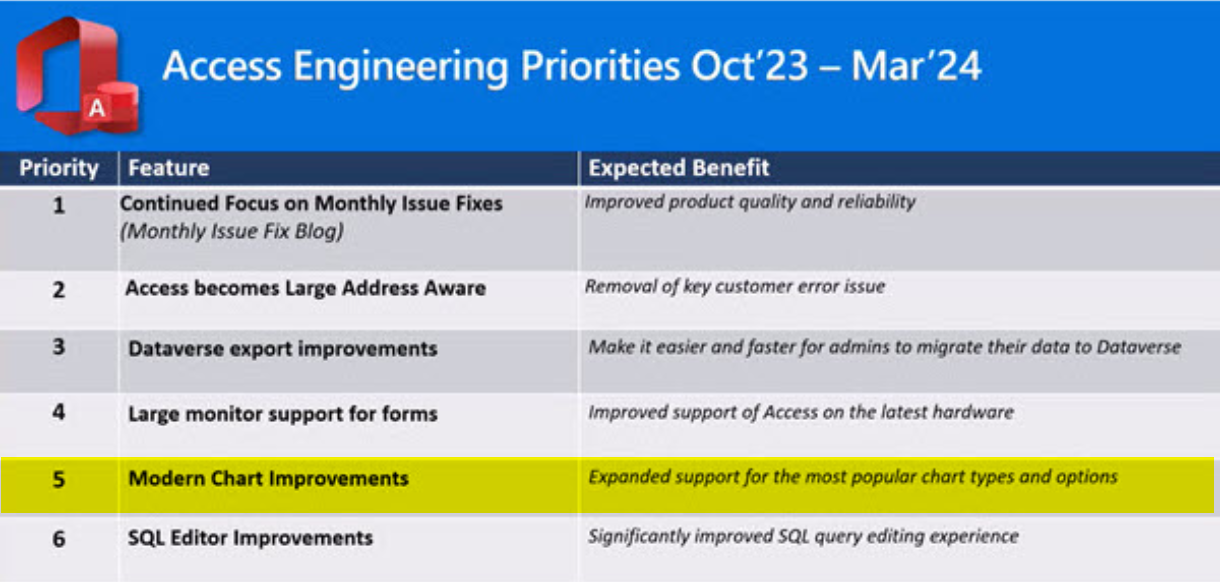
Unfortunately for the A team, Microsoft barely provides them with the resources to maintain the product, let alone spend the time that they'd like to adding new features.
Which brings us to the upcoming Access Europe User Group speaker, Thomas Möller, and his passion project Better Access Charts.
Better Access Charts: Part 1
Thomas has presented on this topic in the past. You can watch his earlier presentation on YouTube:
Longtime reader of the blog, Kent Gorrell, shared his excitement with me via email for Thomas's follow-up presentation (shared with permission; lightly edited):
Two years ago I spent a few days with Thomas Moeller’s Better Access Charts as it showed real potential but I came up against some road blocks. I’ve just looked at his latest version that he is presenting next week. I think it is now brilliant.
I respect Kent's opinion on these matters, so I gave it a fresh look (I too had looked at the project a few years ago).
The charts are still every bit as great as they were in the past, but the VBA that runs the charts has gotten a complete overhaul. Specifically, what was once a single monster class has been properly divided into many smaller classes, each with a single responsibility.
Better Access Charts – The Next Generation
Below are the meeting details and topic outline from Colin Riddington's announcement post:
Meeting Details
This Access Europe meeting will be on Wednesday 6 Mar 2024 starting at 18:00 UK time (6PM UTC) and finishing at about 19:30 (7.30PM)
The start time is equivalent to 19:00 (7PM) in Central Europe[, 1PM New York / EST,] and 10AM in Seattle / PST
Please note that the UK is currently on Winter Time (UTC). For local times, please check World Time Buddy
We use Zoom as our meeting application. Please click this link to Get Zoom if you don’t already have it.
When the time comes for the meeting, please use the following link: Join Zoom Meeting
If you are asked, use: Meeting ID: 924 3129 5683 ; Passcode: 661210
For more connection options, please see the AccessUserGroups.org web page for this event
All sessions are recorded and later uploaded to the Access User Groups channel on YouTube
If you do not wish to be part of the recording, please ensure your webcam and microphone are both switched off during the meeting.
Topic Outline
By popular request, this presentation is a continuation of Thomas Moeller's highly regarded Access Europe presentation from February 2023.
Thomas will demonstrate what has changed in Better Access Charts since that time.
Specifically, it concerns the following topics:
Divide and conquer
- Divide a monster class into 20 simple classes
Pictures of you
- Take a picture from a chart and put it on a report
You are fired
- How to get rid of the HTML file
Living on the edge
- Challenges with the new Edge browser control
New kids on the block
- Adjustments to run Chart.js v3 & v4
To prepare for this upcoming presentation, it may be a good idea to make yourself familiar with Better Access Charts
It would also help to watch the earlier presentation from February 2023: State-of-the-art charts in Access using charts.js